Nasdaq, gold and bitcoin each have their own strategy. One system reads each market, sizes each trade for risk and carries the decision through to execution. Follow them as one portfolio instead of watching three markets separately. The system is designed to trade all three together, so a weak stretch in one may be offset by the others.
02 What we trade
Nasdaq, Gold, Bitcoin.
Each market has its own rhythm: Nasdaq trades in the New York morning, gold in the Asian session, and bitcoin only on Sundays.
NQNasdaq 100 futuresThe Pillar
◷ New York morning, entry 10:00 ET
Takes long positions in rising markets and short positions in declines, though not in equal measure. Results have been stronger in some years than in others.
+257RMDD 18.4R2014-2026 walk-forward
GCGold futuresThe Duelist
◷ Asia session, entry 02:00 ET
It relies on risk/reward rather than a high win rate: losses stay small while winning trades have room to run.
+226RMDD 28.9R2017-2026 walk-forward
BTCBitcoinThe Hunter
◷ US evening session, entry Sun 18:00 ET
Trades only on Sundays - and stands aside when the conditions are not met.
+254RMDD 9.8R2021-2026 walk-forward
Times shown in US Eastern time.
Each asset entered the portfolio at a different time, so cumulative R cannot be compared directly between them.
Day to day the three barely move together: daily P&L correlations are NQ-GC -0.00, NQ-BTC never on the same day, GC-BTC never on the same day (|r| ≤ 0.00, 1,891 calendar days since 2021-07, no-trade days counted as zero). Drawdowns shrink too: over the window since 2021-07, when all three ran together, each asset’s worst run adds up to 50.1R, while the combined portfolio’s is 22.6R.
Sessions spread across the day - no overlap
GOLD, Asia, Mon-FriGOLD
NQ, NY, Mon-FriNQ
BTC, US, SunBTC
BTCBTC
00:0006:0012:0018:0024:00 UTC
Natural diversification. Nasdaq and Gold trade on weekdays in their own sessions; bitcoin trades only on Sunday, when Nasdaq and gold are not trading. Different asset markets, different hours - a bad day in one is rarely a bad day in all.
You can start with one. The three-market record above is a destination, not a requirement to get started. Accounts connect per asset, and the system works with just one connected. You still receive signals for all three and choose which ones to act on. Without your own trading capital, you can trade gold and Nasdaq at standard size through the prop route. To start with less, you can trade fractional bitcoin on a crypto exchange, with no contract minimum.
03 The System
More Than a Signal.
EdgeQuant System
1 Market Understanding
↓
2 Quant Decision
↓
3 Risk Management
↓
4 Portfolio Allocation
↓
5 Automated Execution
From prediction to portfolio execution.
We trade only as much as needed. EdgeQuant works off the 4-hour bar. Nasdaq and gold take at most one entry per trading day, and bitcoin at most one entry on Sunday. Positions close at a set time, and the stop sits at your broker from the start. You can see the full exit rules after signing up for the free Preview tier. Sign up free → No scalping, no adding to a losing position - each asset enters by its own fixed rule and exits on its own fixed condition.
The three core ideas
01PredictionInstead of combining hundreds of indicators, a learned model reads a small set of decision-relevant inputs and predicts the market direction. The same inputs always produce the same result.
02SizeA correct direction does not mean the same position size. Position size is set per signal, between 1R and 3R. Apart from no-trade days announced in advance, early closes and market holidays, there is no human discretion in the loop.
03Per-asset filtersEach asset has its own filters. When a filter blocks a trade, the card says NO TRADE.
The three layers, the features and the validation pipeline are set out in Algorithm architecture.
Signals reach every member in the same format.
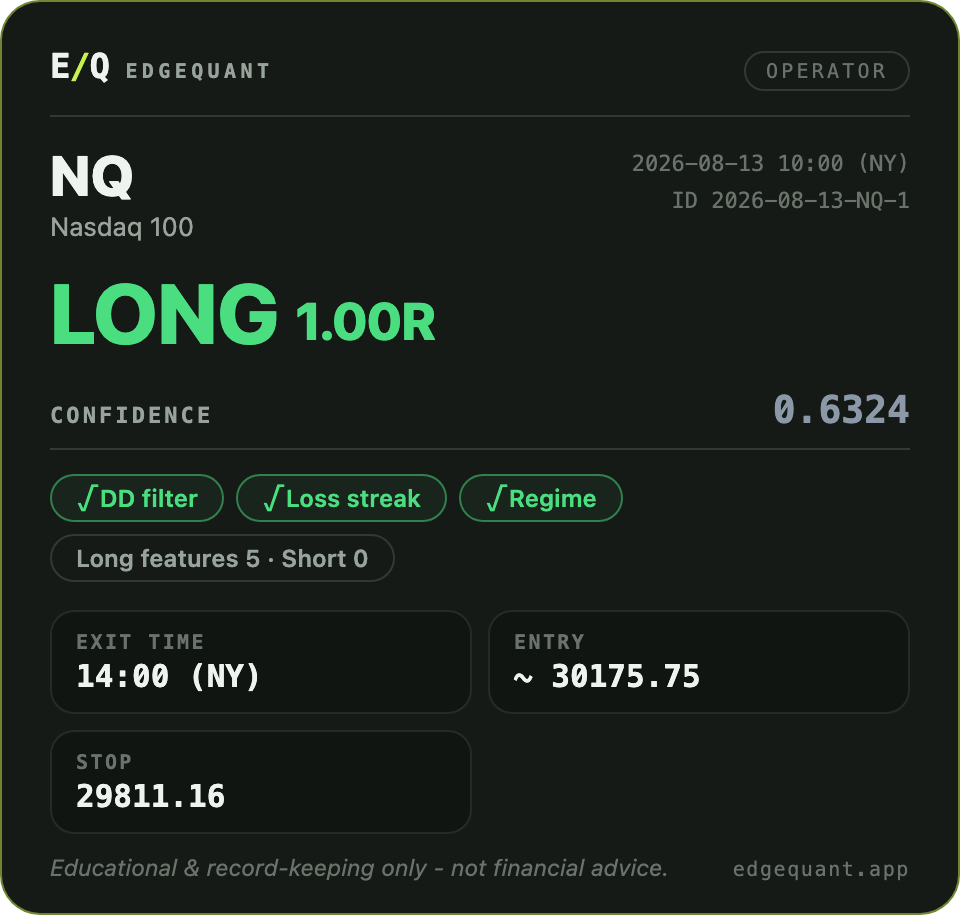
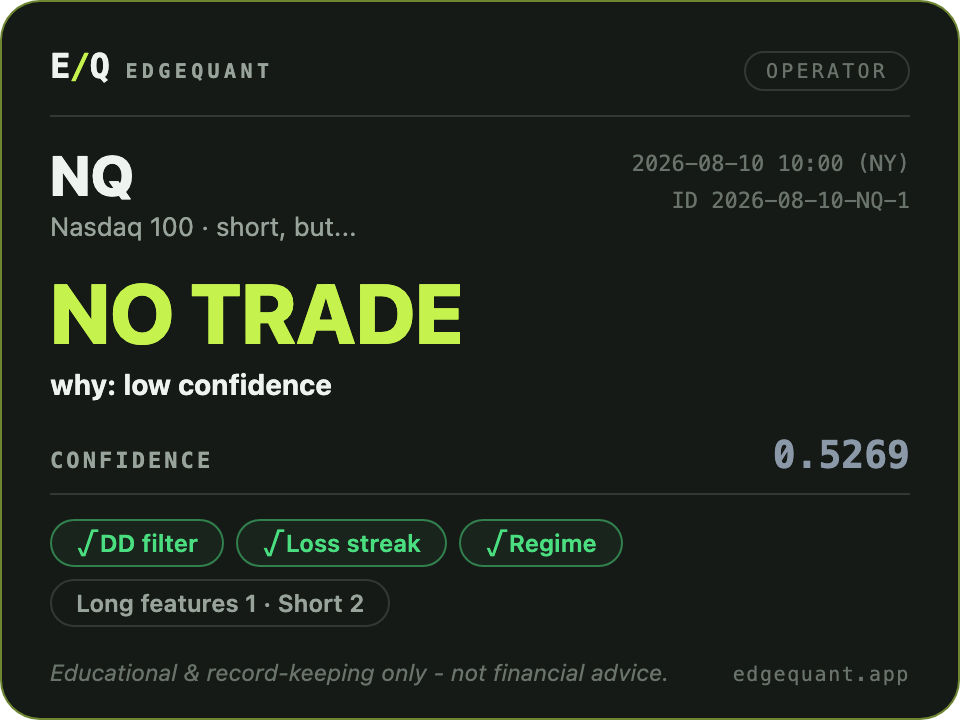
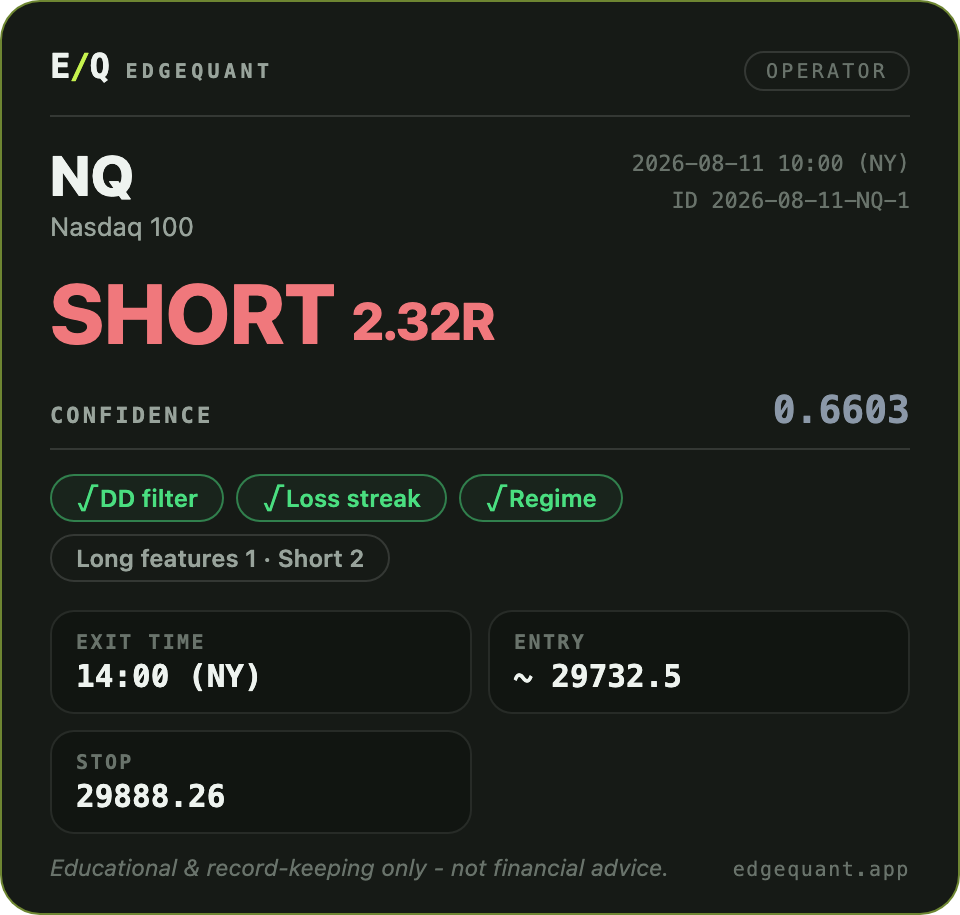
Sent 2026-08-13 - NQ longSent 2026-08-10 - NQ, stood downSent 2026-08-11 - NQ short
Long, short, or no trade by design. Every member gets the same card, showing the market, direction, entry reference, stop, exit time, and whether the confidence and risk filters passed. If conditions are not met, it says NO TRADE and explains why. The system records that decision on the same terms as a trade.
The R figure next to the direction is relative position size, not an amount of money. Confidence is the gate that decides whether to enter at all; it does not set the size.
From there, execution is handled by EQ Autopilot. ↓
04 EQ Autopilot
Not a signal copier. A trade execution engine.
From automatic signal detection to execution.
EQ Autopilot is a desktop app that turns EdgeQuant Signals into orders, automatically and within the limits you set. It runs on your computer and uses your API keys to place orders in your account. You set a risk amount (1R) for each account; the app converts it into contract size. The same Signal can therefore lead to different position sizes - or no trade - for different users.
Supported brokers: Topstep (ProjectX), Lucid Trading, Tradovate, Bitget, Bybit. More are being added.
What running it requires
For as long as a position is open, EQ Autopilot must be running on a computer with an internet connection. Entry times are 10:00 ET, 02:00 ET and Sun 18:00 ET. If you are away, leave the computer on and disable sleep. Your broker decides whether VPS or remote-server use is allowed; Topstep, for example, prohibits it. If your computer shuts down while a position is open, its stop order remains with the broker or exchange, not EQ Autopilot. Scheduled exits will not happen until EQ Autopilot is running again. No new entries are placed while it is off. A stop does not guarantee a price. Once triggered it becomes a market order, so in a gap it can fill materially worse than the stop level. If EQ Autopilot stops responding for more than 15 minutes, we alert you through the Telegram or Discord account linked to your membership. Once setup is complete, a few minutes of daily checks is all it takes.
01Portfolio allocationCapital spread across NQ, Gold and Bitcoin by design, not guesswork.
02Contract size from your own 1RContract size comes from the 1R you set. No discretion is involved; contracts are whole numbers, so rounding can take a trade slightly past 3R, and a gap can carry an actual fill further.
03Entry & exit automationOrders and risk management are handled automatically based on EdgeQuant signals.
04Risk controlHard stops and risk filters enforced automatically.
Go Live - one switch arms the markets you checkedPer-asset accounts - your brokers, your risk unit
Screenshots from EQ Autopilot - click either to see it full size
EdgeQuant never holds your funds or makes discretionary trades in your account. You can stop execution at any time; you remain in control.
Security and permissions - your keys stay on your computer, and the app uses only the access needed to trade. We never ask for exchange withdrawal permission, and futures-broker APIs have no withdrawal function at all. With NinjaTrader, credentials never pass to EQ Autopilot. Your API keys, secrets and passphrases are stored in your computer’s OS secret store, never on our servers; host names, ports and account labels stay in the EQ Autopilot config file. Your API keys, secrets, passphrases, passwords and PIN are never sent to the EdgeQuant server; keys and passwords go only to your broker, directly from your computer. Everything the app does send is listed in full in privacy policy 5.4. One caveat: to actually place orders, stops and closes, a read-only key will not work. We take the minimum permission required - and disclose the full scope.
What we ask for, broker by broker
Bybit and Bitget: one permission is enough - contract trading (orders and positions). There is not a single withdrawal or transfer API call in EQ Autopilot. One write we name plainly: if your balance falls short just before entry, EQ Autopilot raises that symbol’s leverage setting - a trading-scope write, not a wallet permission. The raise applies to that one symbol only, never beyond the exchange’s own cap, never downward - and actual risk stays pinned to the stop, at most 3R on a single trade by design like everywhere else in this system (contracts are whole numbers, so rounding can take it slightly past; on a gap an actual loss can exceed it).
TopstepX cannot split key permissions - but zero of its documented endpoints move money, and payouts require tax forms and bank verification on the Topstep dashboard. With NinjaTrader (Lucid and your own account), you log in inside NinjaTrader and the two programs talk only inside your own machine.
Secret storage: macOS Keychain / Windows Credential Manager, never sent to EdgeQuant servers. If your machine has no working secret store, EQ Autopilot tells you so rather than pretending.
Windows is recommended: the NinjaTrader 8 bridge (Lucid, Tradovate) runs on Windows only. Topstep and the crypto exchanges run on macOS as well.
05 Access
One system. Three ways to run it.
Membership comes in three tiers: Preview, Operator and Autopilot.
You get the same signals whichever tier you choose. Decide how much you want the app to handle - from checking the record to automating every order.
Paid membership is open - the Preview tier stays free.
Founding-member rates come in a limited number of places: as places are taken, the rate steps up to the next tier. How many places remain at the current rate is published on the membership page. Founding rates stay open through November 12, or close earlier if every place is taken first.
Preview
Verify
See the results. Check the record for yourself.
The full track record and the Signals are public (120-minute delay on the channels and the web). Review them before committing capital. Start in seconds with Telegram or Discord on the registration page.
Preview can download EQ Autopilot as well. For assets with an account turned on in EQ Autopilot, signals may show up earlier in EQ Autopilot. This is a bonus outside the contract and can change or end at any time. The web view stays at 120 minutes.
Get each Signal with its entry and stop in real time in Telegram, Discord or EQ Autopilot, plus reminders 10 minutes before entry and 5 minutes before Nasdaq and gold exits (the bitcoin exit message comes at the moment of the decision). You place entries yourself at the scheduled times (10:00 ET, 02:00 ET, Sun 18:00 ET); EQ Autopilot handles the scheduled Nasdaq and gold exits, and you exit bitcoin and move its stop yourself, following the channel messages. Choose the Autopilot tier to automate entries too.
The Operator tier suits traders with up to two prop accounts who can place entries at signal time.
Connect all three assets and a 14-day Autopilot trial opens.
The app places entries and manages stops and exits, sizing each position from the 1R you set. It works the same whether you trade one market or all three.
The Autopilot tier may suit you if you're running 3+ prop accounts, have substantial capital, or can't be at the screen at Signal time. The app places the entry order in your own account.
The paid tiers are monthly subscriptions, and the price shown includes value added tax. Cancel any time; a 14-day right of withdrawal applies. The Autopilot tier, including its trial, is not available to US residents (Preview and Operator are). For restrictions in your country, see Section 7 of the Terms.
The amount on the Autopilot card is the regular price. Right now the founding member rate of $199/month is running, and how many places remain at each rate is published on the membership page.
Yesterday’s trades become today’s data. EdgeQuant’s edge sharpens every day.
06 Track Record
The number matters less than how it was produced.
We publish walk-forward results alongside records of the same Signals running in the architect’s accounts. Review both the results and how they were produced.
Walk-Forward Validated Public record of live trades Net of Fees & Slippage Signal timestamps independently sealed (RFC 3161)
Every archived signal is time-sealed daily by an independent timestamping authority (FreeTSA, RFC 3161) - if we rewrote a past record, it would show. Verify it yourself → Daily sealing has run since 2026-09-05; for records that predate it the independent witness is the channel post made at the moment of the send. The sealed originals are public: /seal.txt carries the fingerprints and /proof/ holds the files they point to.
+737R
Cumulative result (walk-forward validated)
42.2RMax drawdownlargest peak-to-trough decline, 21 months to a new high (about -$21,100 at 1R = $500)
17.5Recovery Factorcumulative return ÷ max drawdown
Walk-forward validation trains the model on past data, then tests it on the next period the model has not seen. We repeat this process across successive periods. The figures here come from those out-of-sample tests.
This describes how the model learns. Other design choices - the session each asset trades, when it entered the portfolio, the execution rules (the conditions that filter out entries, and exits), the risk multipliers, and some learning settings - were set after reviewing the full period. We chose settings that held up better under stress tests, even when they produced lower returns.
All figures are net of exchange fees, commissions and slippage, and exclude the EdgeQuant subscription fee. Entries, timed exits and stops are modelled as market fills; we assume no savings from limit orders. Slippage is set at half a tick per futures leg and 0.002% per crypto leg. See the robustness tests for the two-tick stress case.
201420162018202220242026
Shaded: deepest drawdown 42.2R (2016-04 to 2018-01, peak to recovery)
Walk-forward (simulated) portfolio cumulative PnL (R) - equal-weight NQ, Gold, Bitcoin, 2014 to present. The left scale is in R; the shaded band marks the deepest drawdown. As of 17 Oct 21:57 CEST.
How long the deepest drawdown lasted matters too. The peak formed in April 2016, the trough came in November 2017, and the new high arrived in January 2018 - 21 months from peak to new high. Using this system means being able to hold the same rules through 21 months without a new high. (The max drawdown measures the full decline across two calendar years, which is why it is larger than any single worst year - the two numbers measure different windows.)
11 / 13
Positive years (2 partial)
-16.9R
Worst year (2017)
+42R
Median year (11 full years)
+248R
Best year (2024)
Year
Nasdaq
Gold
Bitcoin
Portfolio (R)
Trades
Average R
2014*
+7.1
-
-
+7.1
19
+0.37
2015
-11.3
-
-
-11.3
45
-0.25
2016
+28.3
-
-
+28.3
49
+0.58
2017
-2.1
-14.8
-
-16.9
95
-0.18
2018
+15.1
+72.5
-
+87.6
133
+0.66
2019
+14.0
+54.7
-
+68.7
127
+0.54
2020
+2.2
+6.2
-
+8.4
152
+0.06
2021
+14.7
-17.9
+30.4
+27.2
125
+0.22
2022
+4.3
+42.4
+12.4
+59.1
157
+0.38
2023
+11.4
+35.0
+38.0
+84.4
171
+0.49
2024
+146.0
+30.4
+71.5
+247.9
156
+1.59
2025
+10.5
+20.6
+11.0
+42.1
169
+0.25
2026*
+17.2
-3.4
+90.5
+104.3
125
+0.83
Reading these figures: 2024 contributed +248R, about 34% of the total cumulative result; excluding it, the Recovery Factor falls from 17.48 to 11.6. Since July 2021, when all three assets have run together, the result is +538R with a max drawdown of 22.6R. Over the last 22 months (since January 2025), bitcoin made up about 69% of the result - Nasdaq and gold +44.9R, bitcoin +101.5R. The 42.2R max drawdown ran from April 2016 to November 2017 and was recovered by January 2018 (21 months from peak to new high), before Bitcoin joined the portfolio. The first and current years are partial, and a dash (-) means the asset was not yet in the portfolio. We do not set a minimum number of signals per day, week or month - a stretch of several days without a signal is normal system behavior, not a defect.
Without 2024, the total is +489.1R, the max drawdown 42.2R and the Recovery Factor 11.6. 2024 alone is about 34% of the total. To see the result without leaning on one year, look at this curve.
Concentration exists at the asset level too, not just the portfolio total: most of Nasdaq’s cumulative result is concentrated in 2024 alone, and shorts - 15% of its trades - account for about 53% of its cumulative result, and the year table above shows each asset’s spread as it is - read each column, not just the totals.
Computed 2026-10-17 21:57 CEST, method rev 2026-10-12 (e379615d) Every change to the method is recorded on one page, each re-computation included - never silent. View the change log (11 entries, latest 2026-10-12) →
We deliberately try to break it to confirm robustness. Every week we run four kinds of control: shifting each parameter off its chosen value, shuffling the training order, stripping features one at a time, and randomizing the model’s direction with a coin flip. The point is not to pick a setting but to see how far it degrades, and the runs that come out lower under perturbation are published as they are, not left out. Give random directions the same optimization budget we use, across 100 random draws (60 for Bitcoin), and the validated PnL still comes out ahead in 100% of runs for Nasdaq, 97% for Gold and 98% for Bitcoin (by Recovery Factor: 93%, 99%, 100%). Nasdaq is measured over a recent window; Gold and Bitcoin over the full period. robustness tests →
In money terms
Dollar amounts on this page use 1R = $500, the same base as the fee-adjusted figures. Live accounts size each market separately, so the architect’s own 1R differs per market and shows in the screenshots below. 1R is an amount you choose, and the level we recommend for it is 0.4% of your capital per trade, so $500 is what that works out to on an account of about $125,000. On that unit the cumulative +737R is +$368,500, the worst year (2017, -16.9R) is -$8,450, and the 42.2R max drawdown (on the combined three-asset curve; during that drawdown, 2016-04~2017-11, Bitcoin was not yet in the portfolio, and gold joined partway, in 2017-04) is -$21,100.
A single trade risks at most 3R (1.2% of capital at the recommended risk, 3% while seed-stage sizing is in use, 6% for bitcoin until $30,000), so on the default unit the worst case on one trade is -$1,500 by design. That is a design limit, not a guarantee: contracts are whole numbers, so rounding can take a trade slightly past it, and a stop order fixes the price you ask for, not the price you get, so on a gap the actual loss can be larger. And the unit cuts both ways: set 1R much smaller and the order stays under the bundling threshold - above ten micro contracts we switch to minis - so the higher per-contract micro commission applies to every contract, and the net result comes out below the tables above.
How we test the trading rules
1. Checking that rules set on the past still work afterwards
We set the rules on past data, then measure the results on the period that follows. Repeating this across the whole history is walk-forward testing.
Trading costs such as commissions and slippage are included.
Walk-forward testing does not mean every design choice is independent of the data in the test periods. The session each asset trades, when each asset joined the portfolio, the entry filters and exit rules, the risk multipliers and some learning settings were decided after looking at the full period. See the walk-forward record →
2. Checking it holds up when conditions change a little
We check the result on different charts. The same market's price data differs by data vendor, by micro or mini contract, and by how contract months are joined. We test again on the other data and see how much the results change.
We check the result when prices are a little different. We also test on synthetic data with prices deliberately nudged. We are wary of a strategy whose results swing on a few ticks.
We check it is not overly sensitive to its settings. We change the main settings a little at a time and compare the results. A strategy that does especially well at one particular value only is not adopted. See parameter sensitivity →
We test under unfavourable conditions, not only favourable ones. Instead of the settings with the best result, we choose the ones that hold up relatively well when conditions get worse. See the robustness tests →
We check the results do not change much when the randomness of training or the starting point changes.See training seed robustness →
3. Checking it is not just luck
We compare against random trades. We build a control group whose trade direction is chosen at random and compare it with the real strategy, to see whether the real result is at a level chance alone could produce. See the random direction control →
We check the periods separately. We split the whole record into an earlier and a later period and look at each, to see whether the results are concentrated in one period. See results by period →
We check the profit is not concentrated in a few trades. We look separately at whether a particular year or a handful of large winning trades made most of the overall result. See the best-year share →
Pass criteria are set, and the results are also reviewed separately from the point of view of refuting them. When a change is adopted although it fell short of a criterion, that fact goes into the change log.
4. Testing under real trading conditions
Backtest numbers alone are not enough. We also account for the costs of real trading and for account rules.
Results are calculated in whole contracts that can actually be traded.
For prop accounts, pass or fail is judged by applying each firm's official rules to day-by-day results, including loss limits and consistency rules. See the prop simulator →
The intraday loss-limit check is an approximation and can differ from the firm's own ruling.
5. Watching first when a rule changes
Where possible, a new rule is not applied straight away. It runs next to the existing rule, recording its signals, and we look at the results before applying it. We call this a shadow run.
A change with a short shadow run, or none, is not hidden: it is recorded in the change log.
We also record what changed and when, and how the results changed afterwards. See the change log →
6. Checking every day while it runs
Testing does not end at launch. Every day we check that the signals actually sent are produced by the rules that were tested.
Rule match: An automatic check compares whether the actual signals went through the same decision process as the rules used in testing.
No future information: We check that no information that was unknown when the signal was made went into the decision.
Record integrity: The record of sent signals is sealed every day with a certificate from an independent timestamp authority. If a record were changed afterwards, the change would show. See the sealed records →
We publish not only the test results but also the signals actually sent and the trading results. Winning and losing trades can both be checked. See the architect's trading account record →
7. Failed experiments stay on record
Experiments that did not pass the test criteria are not deleted.
Keeping the failed attempts means that when an idea is tested again the earlier result can be checked, and what did not work can be tracked.
Past performance does not guarantee future results.
the architect has been executing the same signals in a prop futures account since May 2026, publishing the record - bitcoin runs on a personal crypto account. Architect’s trading accounts →, live signals archived → The published figures come from what EQ Autopilot reported back from broker fills, counted per decision (date and market), not per account - so running the same signal on more than one account does not inflate the count.
Backtest and live can differ
The system has kept improving during the live period, so the backtest and the live window do not run exactly the same system. The live sample is not yet large. On the Signal record (each signal scored at market prices after it was sent), live performance has so far run ahead, but most of that gap comes from a single trade (bitcoin, September 20). We do not read that as superiority - we treat it as a performance discrepancy between backtest and live. Every day the signals actually sent live are compared against the next day’s walk-forward recomputation, and an audit verifies that each send decision reproduces from the same inputs and rules - continuously monitoring discrepancies in both the system and its performance.
Equal-weight portfolio of NQ, Gold, Bitcoin - record from October 2014 to October 2026.
07 vs. DCA
Is DCA enough?
Before the returns: how far did it fall?
Worst drawdown - Our model
−10.7%
Worst drawdown - Plain DCA (monthly)
−32.6%
Same $115,000, same period (since April 2017). Our model is net of trading costs (commissions and slippage) and fees.
Top: month-end cumulative P&L, which changes places depending on when you look. Bottom: each month's deepest drawdown (closer to zero is shallower). DCA is measured from the peak of the account value (money put in included), our model from the peak of the account net of fees.
Both sides use the same $115,000 in total, on data since April 2017, but it goes in differently: DCA spreads it over the months, our model invests it all on day one. Plain DCA puts in $1,000 a month - daily, weekly or monthly, each shown separately - regardless of signals; signal-timed DCA spends the same monthly budget only on days with a long signal. All DCA plans use the mix a weight sweep ranked best by return per unit of drawdown, Nasdaq 70% / gold 30%. Our model puts the full amount in on day one, split equally across its three assets, re-sizes 1R to 0.4% of current capital on every trade (compounding), and pays the Autopilot tier's list price of $399 every month.
Approach
Money in
Worst drawdown (of account)
Return ÷ worst drawdown
P&L (return)
Plain DCA - daily (no signals)
$115,000 ($1,000 a month)
-32.6%
4.7×
+$175,698 (+153%)
Plain DCA - weekly (no signals)
$115,000 ($1,000 a month)
-32.5%
4.7×
+$176,153 (+153%)
Plain DCA - monthly (no signals)
$115,000 ($1,000 a month)
-32.6%
4.7×
+$177,665 (+154%)
Signal-timed DCA (buy on long days only)
$115,000 ($1,000 a month)
-32.6%
4.7×
+$175,155 (+152%)
Our model - three assets, equal weight (1:1:1, compounding, net of the subscription fee)
$115,000 ($38,333 per asset)
-10.7%
101.8×
+$1,257,613 (+1094%)
Our model's worst drawdown was −10.7% (July 2020) - far smaller than DCA's: every DCA plan fell −32.5% or more (October 2022).
Return divided by worst drawdown is 101.8× for our model against 4.7× for the best DCA plan - about 21.5× apart. Accepting the same 32.6% drawdown as DCA, our model could carry about 3.6× the risk, and the result would be far above DCA - we do not recommend that level.
Total P&L was +$1,257,613 for our model net of $45,885 in fees, and +$177,665 for the best DCA plan. Cumulative P&L changes places depending on when you look (DCA was ahead for 8% of this period).
For members on the 20% standing discount (after passing a 150K evaluation), fees over the period come to $36,708 and our model's P&L to +$1,308,326.
Both sides had the same three assets available. The weight sweep, which ranks mixes by return per unit of drawdown, drove bitcoin’s weight in a DCA plan to zero: a plan that only buys and never sells has no way to cut its drawdowns. It stays in our row because our model can take the short side and stop out.
Sizing basis: the model row uses the recommended 0.4% risk per trade and re-sizes 1R to current capital on every trade - it starts at 1R = $460 on $115,000 (a $76,667 futures share for Nasdaq and gold, and the same allocation for bitcoin). In EQ Autopilot you keep the account’s 1R in line with its capital. Higher risk raises profit and drawdown together.
Using the signals only to time purchases changes almost nothing.
All results are simulation; our model row is walk-forward, as of 2026-10-16. Three conditions are set in favour of DCA: its 70/30 mix was chosen with hindsight, its costs are assumed zero, and the comparison above uses whichever DCA cadence earned the most, together with the shallowest drawdown among them. Our model row includes measured fees, 0.5-tick slippage and the Autopilot tier's list price every month ($45,885 over 115 months). BTC perpetual funding fees are not deducted. The subscription did not exist for most of this period, so that cost is an assumption; taxes are left out on both sides. Drawdown is the fall from a peak as a share of the account, with deposits and fees treated as cash flows. DCA uses the same continuous unadjusted futures series the model trades (close prices, no dividends, no roll adjustment). The model drawdown here is for the period since 2017-04; the worst drawdown over the full history is 42.2R, about 17% of capital at the recommended risk, on the three-asset portfolio basis, from April 2016 to November 2017 (before Bitcoin joined). The $500 unit used elsewhere on this page is the same 0.4% on a $125,000 account. Past simulation results do not guarantee future performance.
From checking the record to trading with your own capital.
However you start, the goal is the same: running EdgeQuant with your own capital.
1Bitcoin from $2,000With little capital, start with two 150K prop accounts and a $2,000 bitcoin account. Prop payouts collect in the bitcoin account.
→
2Gold from about $20,000At recent gold prices. Open a futures account and switch gold on yourself. An order goes in only on days when one gold contract fits within 1R.
→
3All three from $30,000Add Nasdaq. 1% of balance per trade up to $50,000, then 0.4%.
Simulated typical case over three years on this path: $77,209 newly built up in the bitcoin account, $9,947 spent (prop costs and the Operator tier fee), $67,262 net profit. In a bad stretch (bottom 10%) the net profit is -$1,580, and the chance of reaching $30,000 within three years is about 85%. The Operator tier figures assume the bitcoin stop is moved on time.
Prop route - simulation results
Prop route: pass an evaluation and you trade at normal size on funded capital. Automated execution at the challenge and funded stages is confirmed per firm, in writing (at some firms automation stops at the live stage, which makes funded the earning stage) (methodology, per-firm comparison and caveats on the prop page). From simulation on past signals: pass rate near 18%, 5.4 attempts on average to a funded account - about $1,466 in evaluation fees on average over roughly 3.7 months. That is money you spend on the prop firm, not revenue, and none of it goes to EdgeQuant. An average hides the unlucky side - at the same pass rate one in four needs 7+ attempts and one in ten needs 12+, with fees rising in proportion (about $1,900 at the one-in-four mark). Simulated, not guaranteed (costs as of 2026-08-09).
Sign up in seconds through Telegram or Discord. It is free, and we do not ask for payment details.
You start on the Preview tier, which stays free.
Pausing
If you need a break, you can pause your membership instead of cancelling.
You can pause for up to 90 days in any rolling 12-month period, at once or in shorter stretches. Billing stops and your tier moves to Preview while paused. Your founding-member rate stays in place.
Close any open positions before pausing. The app will not manage exits while your membership is paused.
Leaving
You can cancel at any time, with no fee or reason required.
You keep access until the end of the period you have already paid for.
You may withdraw within 14 days of concluding the contract. If you requested immediate access, you must pay for the service provided up to the date you withdraw.
The binding terms are in the Terms of Service: dormancy in Section 10, cancellation in Section 11, withdrawal in Section 12. You can cancel from your dashboard or on the cancellation page. For anything else, write to support@edgequant.app.
10 Design and operation
The architect oversees the system’s design and operation and runs it live in a prop futures account and a personal crypto account.
The architect holds a Ph.D. in ECE from UC San Diego and works as a data scientist and researcher. The system follows the same research principles: reproducible results, walk-forward validation, and regular checks for ways a result could be wrong. The architect handles the model, execution, verification and record-keeping, and runs the same Signals in their own accounts. The results are public, and the architect is accountable for the system’s design and operation.
The name and business details are published in the legal notice (Impressum), and the research record and academic activity can be found on Google Scholar.
EdgeQuant
See the results. Verify the process. Run it your way.
In simulation, both routes, your own account or the prop route, came out positive in the typical case after trading costs, prop costs and fees. With little capital, the default is two 150K prop accounts plus $2,000 in bitcoin; the steps and numbers are in 08 above. Automated execution on the prop route is confirmed per firm, in writing, and at some firms automation stops at the live stage. Bitcoin trades in fractional size on a crypto exchange, which means a separate balance held there. Not convinced yet? Watch the live record for free. All figures are simulated and do not guarantee future returns.
Paid membership is open. The Preview tier stays free, and current pricing and payment terms are on the membership page.
Trading futures and derivatives carries substantial risk of loss. This is not investment advice.
HYPOTHETICAL OR SIMULATED PERFORMANCE RESULTS HAVE CERTAIN INHERENT LIMITATIONS. UNLIKE AN ACTUAL PERFORMANCE RECORD, SIMULATED RESULTS DO NOT REPRESENT ACTUAL TRADING. ALSO, SINCE THE TRADES HAVE NOT ACTUALLY BEEN EXECUTED, THE RESULTS MAY HAVE UNDER- OR OVER-COMPENSATED FOR THE IMPACT, IF ANY, OF CERTAIN MARKET FACTORS, SUCH AS LACK OF LIQUIDITY. SIMULATED TRADING PROGRAMS IN GENERAL ARE ALSO SUBJECT TO THE FACT THAT THEY ARE DESIGNED WITH THE BENEFIT OF HINDSIGHT. NO REPRESENTATION IS BEING MADE THAT ANY ACCOUNT WILL OR IS LIKELY TO ACHIEVE PROFIT OR LOSSES SIMILAR TO THOSE SHOWN.
Risk disclosure.
Trading futures and derivatives carries a substantial risk of loss and is not suitable for all investors. Past and walk-forward (simulated) performance shown here does not guarantee future results. EdgeQuant provides information for education and research - it does not provide investment advice or asset management services, and nothing it publishes is a personal recommendation to buy, sell or hold any instrument. You manage your own account and risk, and all trading decisions and their outcomes are your own responsibility.